Rの時系列分析で、日別の販売データのトレンドを掴む
Excelではどうしても限界が来るからできるだけRを使うべきだというのが持論です。
Rを使えばこんなことも簡易に出来てしまうという例として、周期性のあるデータの可視化があります。
日別販売データは、土日が急に高くなって見辛い
総務省の「家計調査」から
例えば、「家計調査」には日別の集計項目が存在します。
統計局ホームページ/統計FAQ 19A-Q18 1世帯当たり1か月間の日別支出
(総務省統計局トップ > 統計データ > 分野別一覧 > 家計に関する統計 - 家計調査
   家計収支編 > 二人以上の世帯 > 詳細結果表 > 月次 > 表番号6-15 用途分類による日別支出、表番号6-16 品目分類による日別支出)
ここから2016年10月-2017年1月の「食料」のデータを引っ張りだして、普通に折れ線グラフにしたらこうなります。

このままでは、いったいいつ頃が増加傾向にあって、いつ頃が減少傾向にあるのか、よくわかりません。
(参考)データを集計しグラフにするまでのコード
dplyr(集計用),reshape2,ggplot2(グラフのため),scales(日付の表示用)などを使う。
youto_10gatsu <- read.csv("youto_10gatsu.csv",header=T)
youto_11gatsu <- read.csv("youto_11gatsu.csv",header=T)
youto_12gatsu <- read.csv("youto_12gatsu.csv",header=T)
youto_1gatsu <- read.csv("youto_1gatsu.csv",header=T)

#データフレームの日付欄をDateデータに変更する関数
datetodate <- function(x){
  x$Date <- as.Date(x$Date)
  return(x)
}

youto_10gatsu <- datetodate(youto_10gatsu)
youto_11gatsu <- datetodate(youto_11gatsu)
youto_12gatsu <- datetodate(youto_12gatsu)
youto_1gatsu <- datetodate(youto_1gatsu)

#データを統合する
youto <- dplyr::full_join(youto_10gatsu,youto_11gatsu)
youto <- dplyr::full_join(youto,youto_12gatsu)
youto <- dplyr::full_join(youto,youto_1gatsu)

#ggplot用にデータを変換
youto_m <- melt(youto,id.vars = c("Date"))


#日付の軸の表示をわかりやすくしグラフにする
g <- ggplot(data=youto_m,aes(x=Date,y=value,color=variable))
g <- g + geom_line(size=1.2)
g <- g + theme_bw()
g <- g + scale_x_date(date_breaks="1 week",
                      date_minor_breaks="1 week",
                      date_labels = "%m/%d")
g <- g + scale_colour_manual(values= c("grey15"))
g <- g + ylab("")
plot(g)
明らかに一週間単位での動きがあるならば、それを除去する作業は簡単
先人の力を借ります。
などを参考にさせて頂きました。
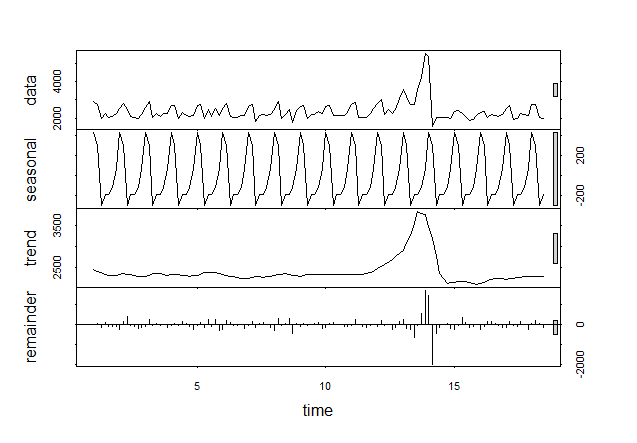
日別データで7日ごとに周期があるのが明白そうであれば、ts関数で季節変動データにする時に「frequency」を「7」にし、stlパッケージでトレンドに分解するとそれらしい分解ができる筈です。

そのコード
#時系列データにする。
youto_t<-ts(as.numeric(youto$食料),frequency=7)
plot(youto_t)

#トレンド等に分解する
youto_t_stl <- stl(youto[,2],s.window="periodic")
plot(youto_t_stl)
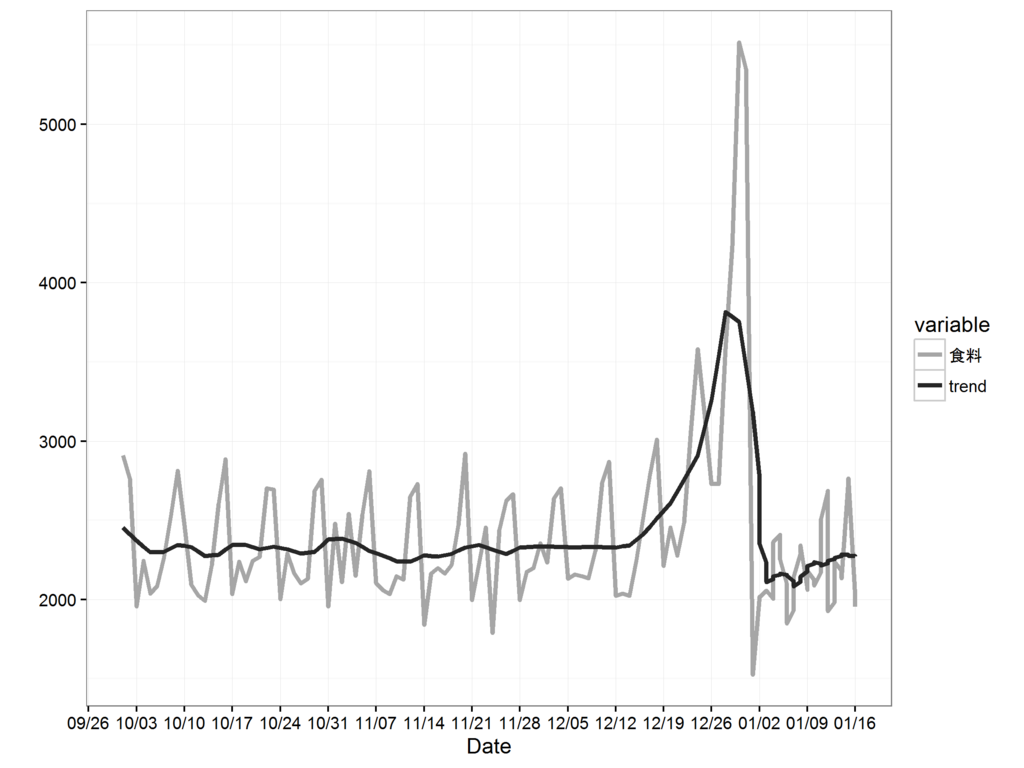
せっかくなので、元のデータとトレンドとを一つの線グラフで見てみる
stlパッケージのままでは、x軸が置き換えられてしまって、肝心の何月といった情報が一覧できませんので、改めてトレンド部分を取り出してggplot2などでグラフにするのが良いでしょう。

年末の買い込み以外は平坦ですね。(食料ですから)
今回は地味なオープンデータでしたが、殆どの販売データというものは土日に偏りがあるものですので、日別のデータが手に入る立場にいる人にとっては使う機会がそこそこあるのではないでしょうか?
そのコード
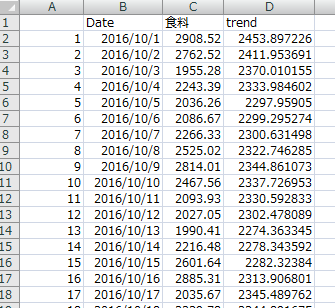
headで適宜データの一部をのぞくと「trend」という項目が、time.seriesの2列めにあることがわかります。それをベクトルデータにして元のデータフレームに列名を付けて追加し、そのデータを元にggplot2でグラフにします。
#トレンドだけ取り出す
head(youto_t_stl)
head(youto_t_stl$time.series)
head(youto_t_stl$time.series[,2])

youto_trend <- youto_t_stl$time.series[,2]

#トレンド項をデータに追加する
youto$trend <- as.vector(youto_trend)

#トレンドをグラフに
youto_t_m <- melt(youto,id.vars =c("Date"))

g <- ggplot(data=youto_t_m,aes(x=Date,y=value,group=variable,color=variable))
g <- g + geom_line(size=1.2)
g <- g + theme_bw()
g <- g + scale_x_date(date_breaks="1 week",
                      date_minor_breaks="1 week",
                      date_labels = "%m/%d")
g <- g + scale_colour_manual(values = c("grey65", "grey15"))
g <- g + ylab("")
plot(g)
何をやっているのか?
7日で周期性のあるとモデル化した部分とそれ以外のトレンド部分とに分けてモデリングしてあてはめているのでしょうか?日本語でググる限り詳解されたサイトはなかなか見つからないので、そう安々と理解できるものではなさそうです。 時系列分析の書籍をあたってアルゴリズムを確認しているうちに日が暮れるので、取り敢えず今は便利なツールとして使っておきましょう。
Excelにしたければ、
他人と共有する上で、画像のグラフだけだと安心しない人が多いので、csvファイルで吐き出せばExcelで渡すこともできます。
write.csv(youto,"youto.csv",quote=F)

今回のコード全体
library("dplyr", lib.loc="C:/r/R-3.3.2/library")
library("ggplot2", lib.loc="C:/r/R-3.3.2/library")
library("reshape2", lib.loc="C:/r/R-3.3.2/library")
library("scales", lib.loc="C:/r/R-3.3.2/library")
library("RColorBrewer", lib.loc="C:/r/R-3.3.2/library")

youto_10gatsu <- read.csv("youto_10gatsu.csv",header=T)
youto_11gatsu <- read.csv("youto_11gatsu.csv",header=T)
youto_12gatsu <- read.csv("youto_12gatsu.csv",header=T)
youto_1gatsu <- read.csv("youto_1gatsu.csv",header=T)

#データフレームの日付欄をDateデータに変更する
datetodate <- function(x){
  x$Date <- as.Date(x$Date)
  return(x)
}

youto_10gatsu <- datetodate(youto_10gatsu)
youto_11gatsu <- datetodate(youto_11gatsu)
youto_12gatsu <- datetodate(youto_12gatsu)
youto_1gatsu <- datetodate(youto_1gatsu)

#データを統合する
youto <- dplyr::full_join(youto_10gatsu,youto_11gatsu)
youto <- dplyr::full_join(youto,youto_12gatsu)
youto <- dplyr::full_join(youto,youto_1gatsu)

#とりあえずグラフにする
youto_m <- melt(youto,id.vars = c("Date"))

g <- ggplot(data=youto_m,aes(x=Date,y=value,color=variable))
g <- g + geom_line(size=1.2)
g <- g + theme_bw()
g <- g + scale_x_date(date_breaks="1 week",
                      date_minor_breaks="1 week",
                      date_labels = "%m/%d")
g <- g + scale_colour_manual(values= c("grey15"))
g <- g + ylab("")
plot(g)
ggsave(plot=g,file="20170320-1.png",dpi=300,width=4,height=3,scale=2)

#季節データ化
youto_t<-ts(as.numeric(youto$食料),frequency=7)
plot(youto_t)
#分解
youto_t_stl <- stl(youto[,2],s.window="periodic")
plot(youto_t_stl)

#トレンドだけ取り出す
head(youto_t_stl)
head(youto_t_stl$time.series)
head(youto_t_stl$time.series[,2])

youto_trend <- youto_t_stl$time.series[,2]

#トレンド項をデータに追加する
youto$trend <- as.vector(youto_trend)

#トレンドをグラフに
youto_t_m <- melt(youto,id.vars =c("Date"))

g <- ggplot(data=youto_t_m,aes(x=Date,y=value,group=variable,color=variable))
g <- g + geom_line(size=1.2)
g <- g + theme_bw()
g <- g + scale_x_date(date_breaks="1 week",
                      date_minor_breaks="1 week",
                      date_labels = "%m/%d")
g <- g + scale_colour_manual(values = c("grey65", "grey15"))
g <- g + ylab("")
plot(g)
ggsave(plot=g,file="20170320-2.png",dpi=300,width=4,height=3,scale=2)

write.csv(youto,"youto.csv",quote=F)